Data Exploration
After you load data, Akila will automatically generate two sections of data:
- File-level summary: a table summarizing the entire dataset
- Column-level summaries: charts and tables will be created for every column
The output is shown here
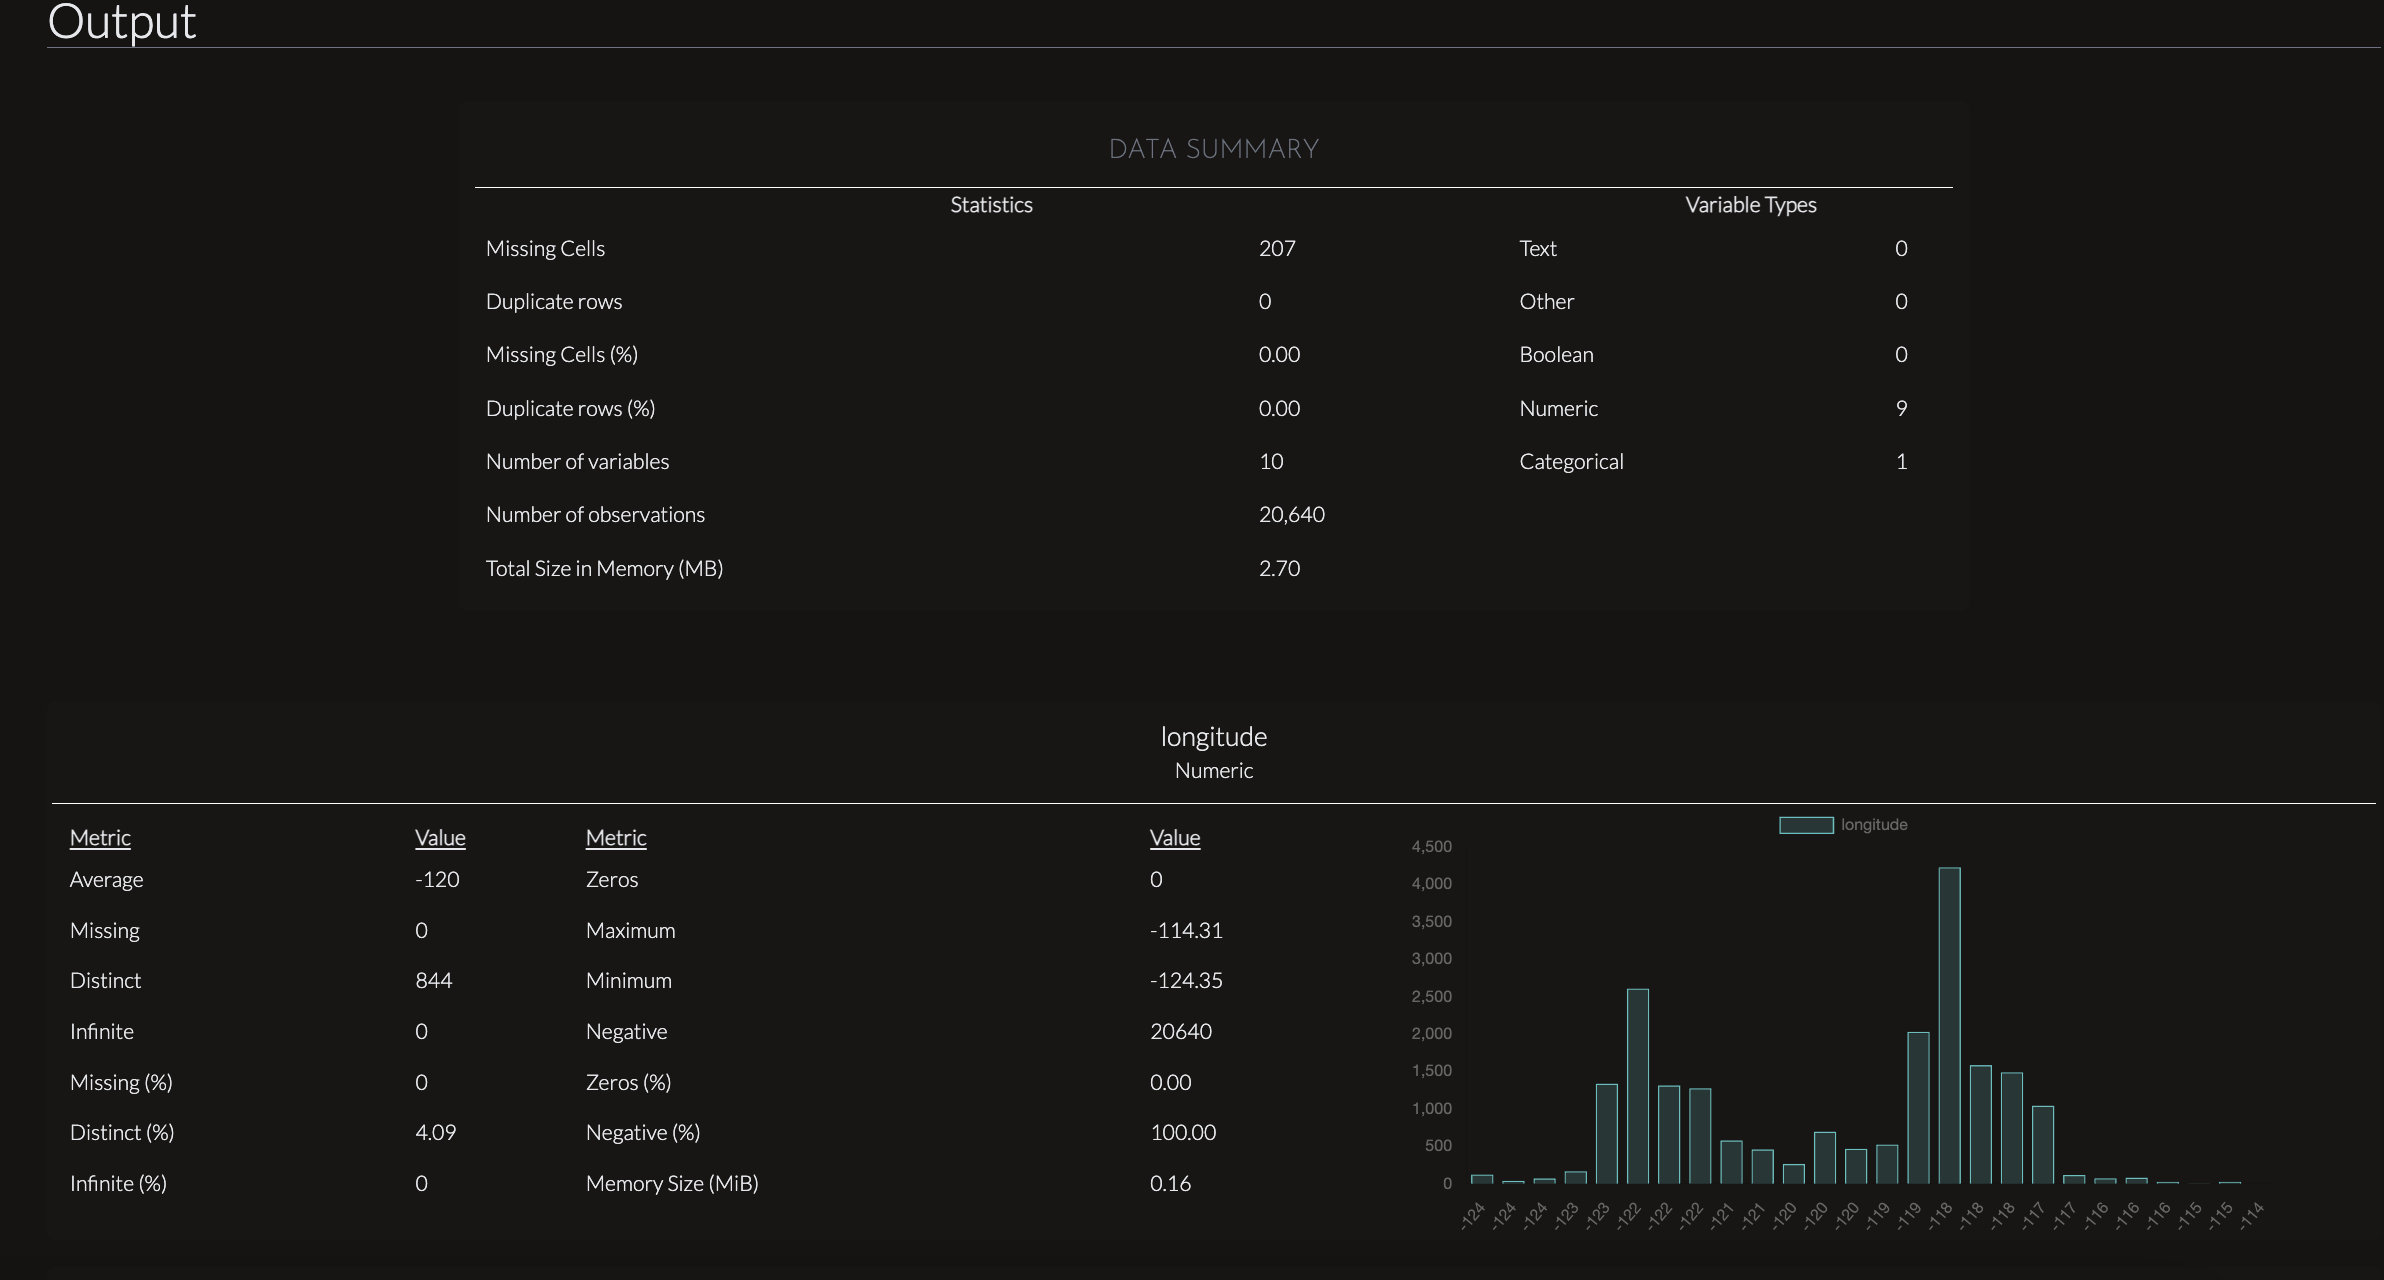
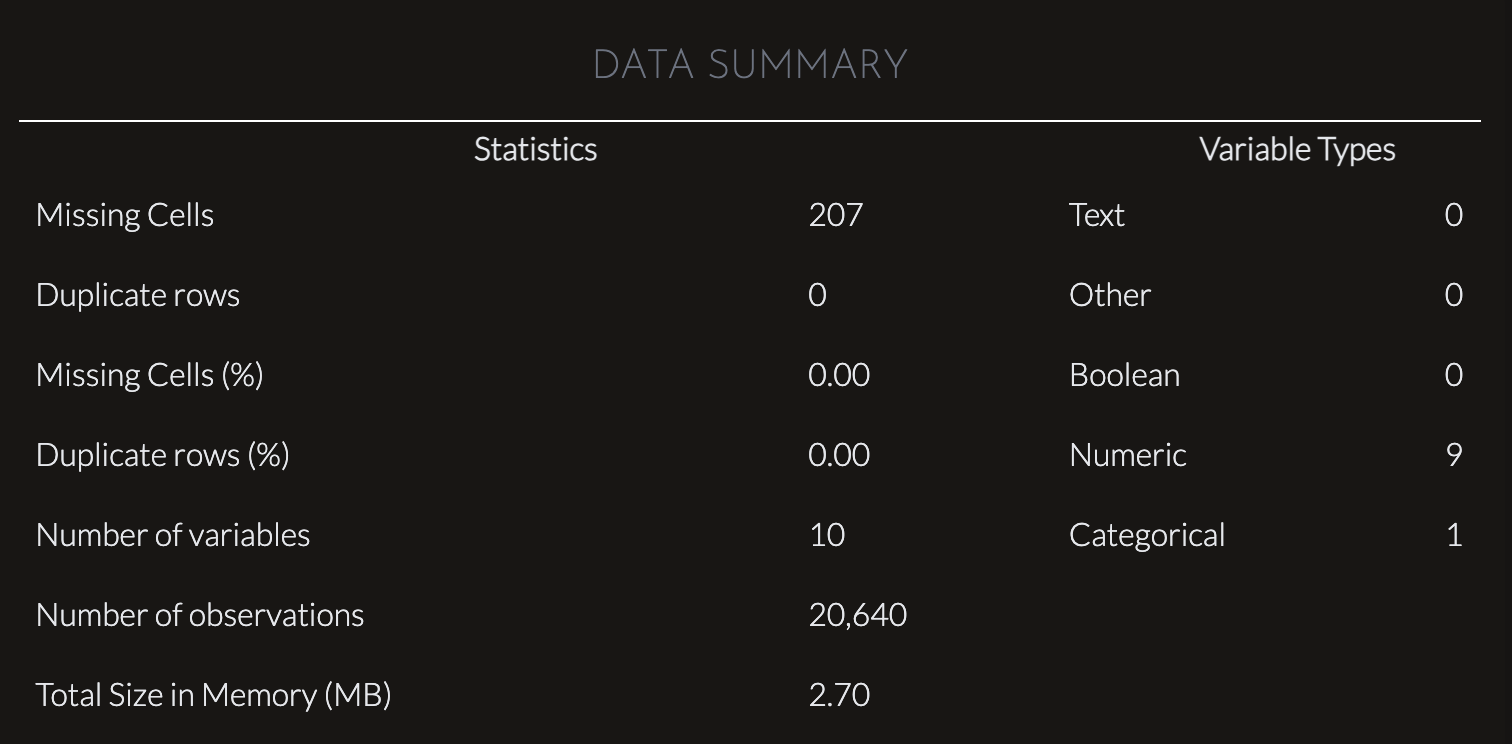
File-level Summary
This chart provides a data summary that outlines key statistics and variable types for a dataset. It indicates that the dataset has 207 missing cells, which account for 0.00% of the data, suggesting the percentage is negligible compared to the dataset size. No duplicate rows are present, either in raw count or percentage.
The dataset consists of 10 variables (columns), with 9 numeric variables and 1 categorical variable. No variables are classified as text, boolean, or other types. The dataset contains 20,640 observations (rows) and occupies approximately 2.70 MB in memory. This summary highlights a clean and concise dataset with minimal issues related to duplicates or missing values, making it well-prepared for analysis.
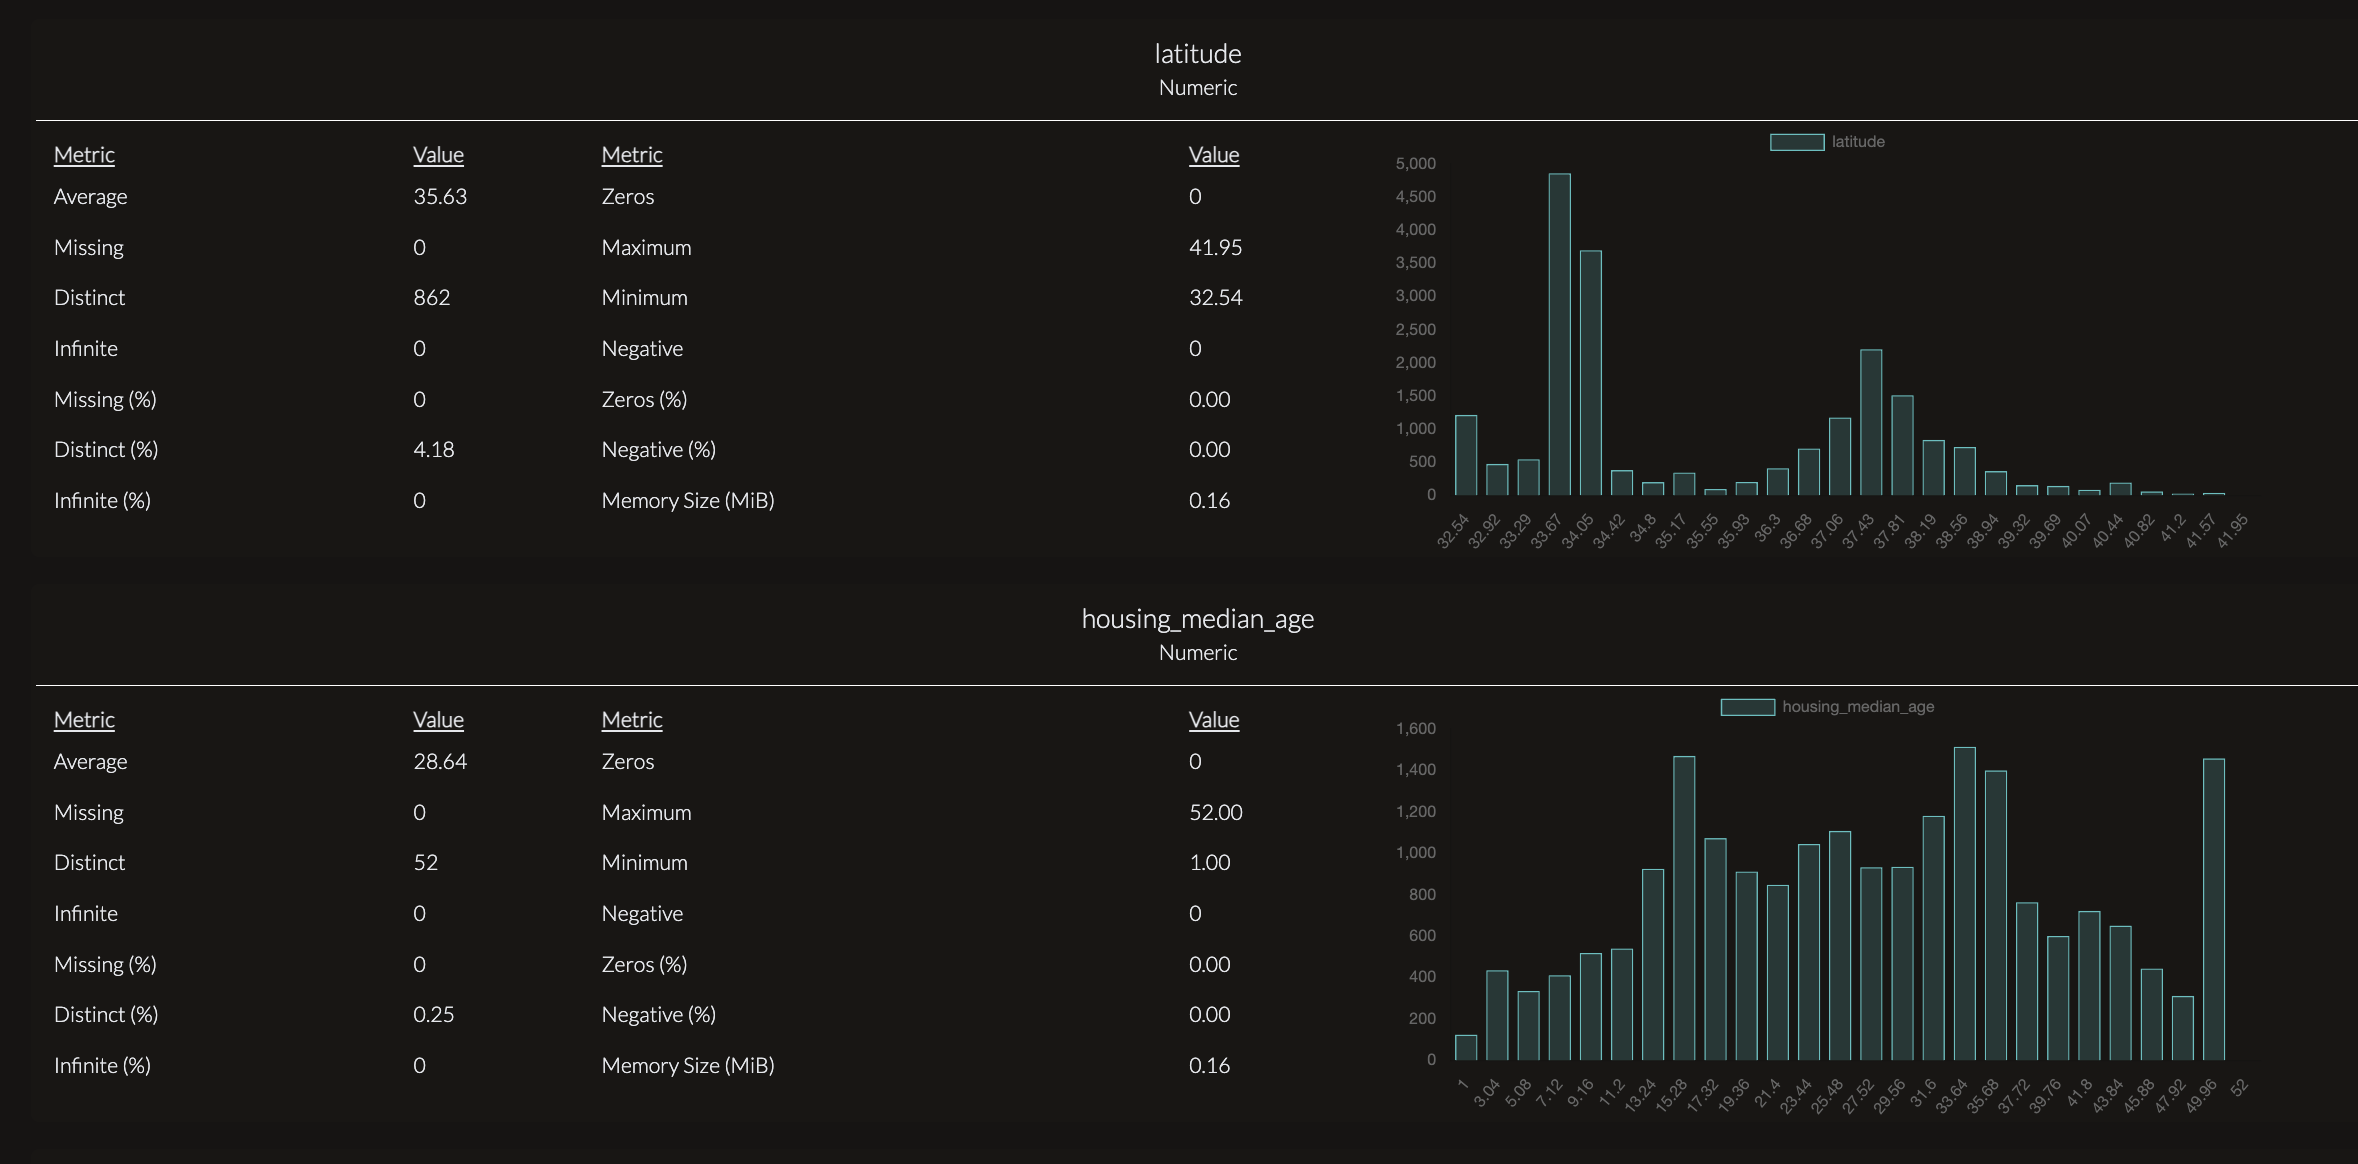
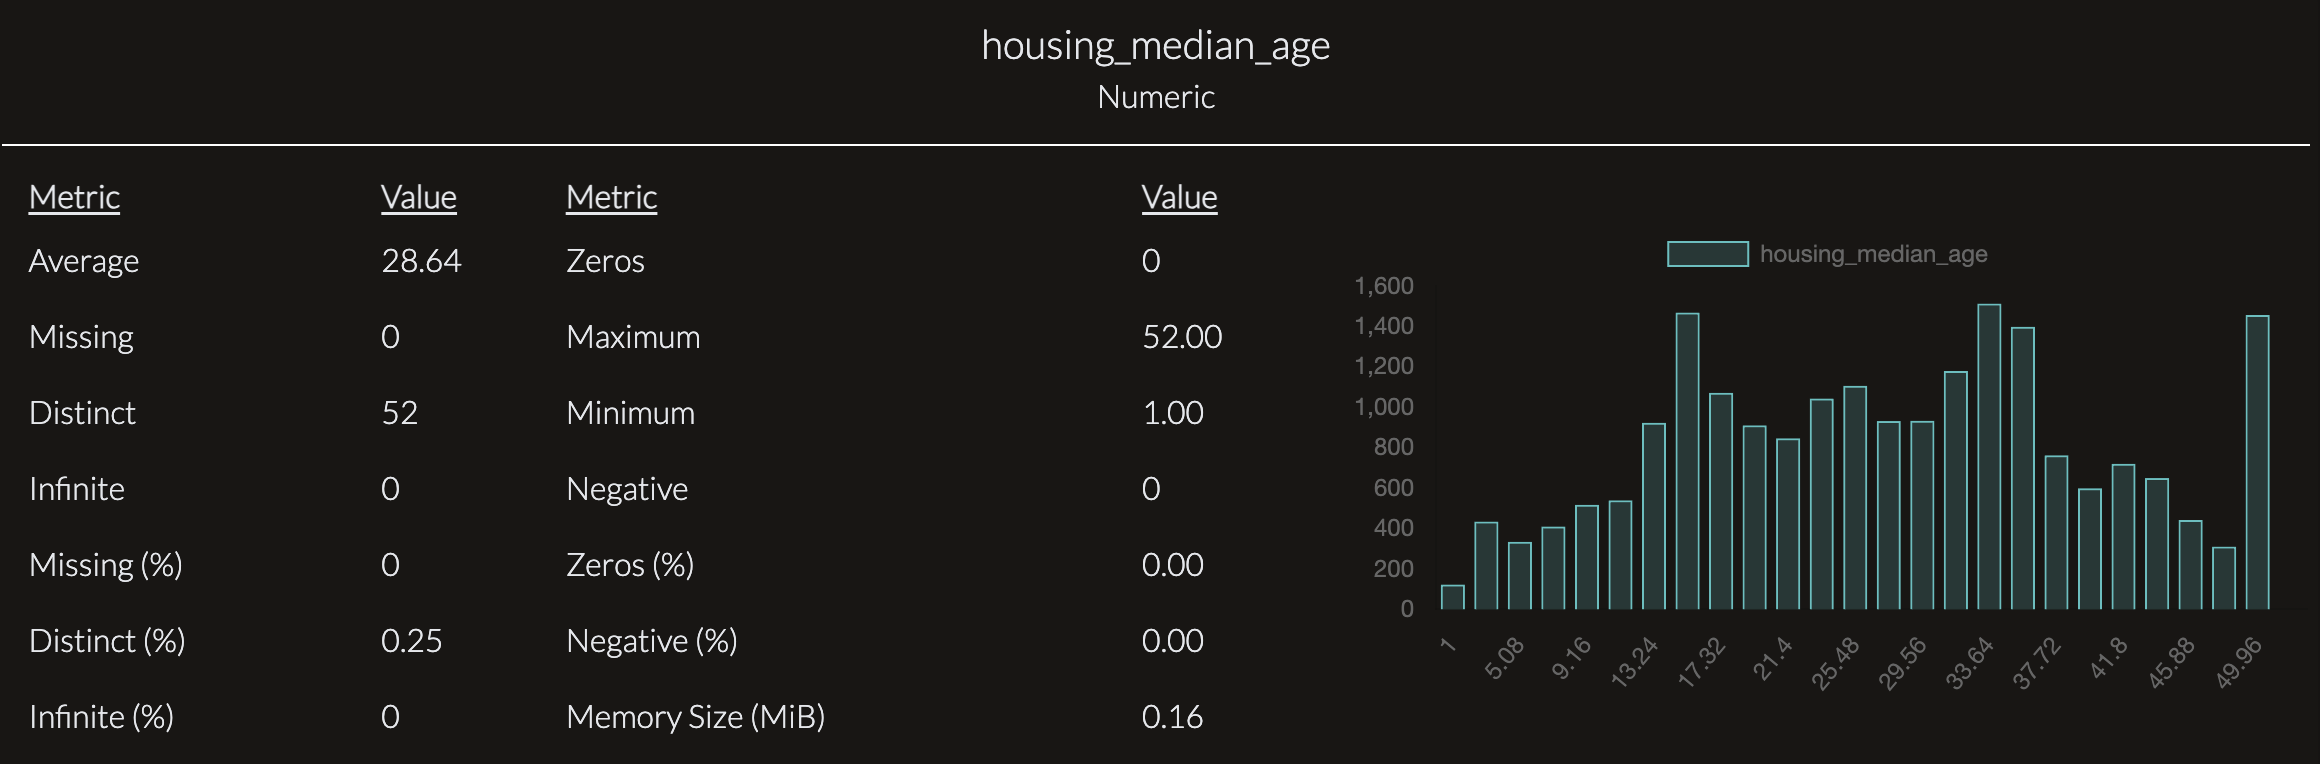
Numeric Columns
Numeric columns will be output in this format. The chart provides an overview of the distribution and quality of the housing_median_age variable. It shows that the data is clean, with no missing or invalid values, making it ready for analysis. The histogram highlights a concentration of properties with a median housing age between 20 and 40 years, with relatively fewer older and newer properties, suggesting that most properties in the dataset are moderately aged. This summary allows users to quickly understand both the reliability and characteristics of this variable without needing technical expertise.
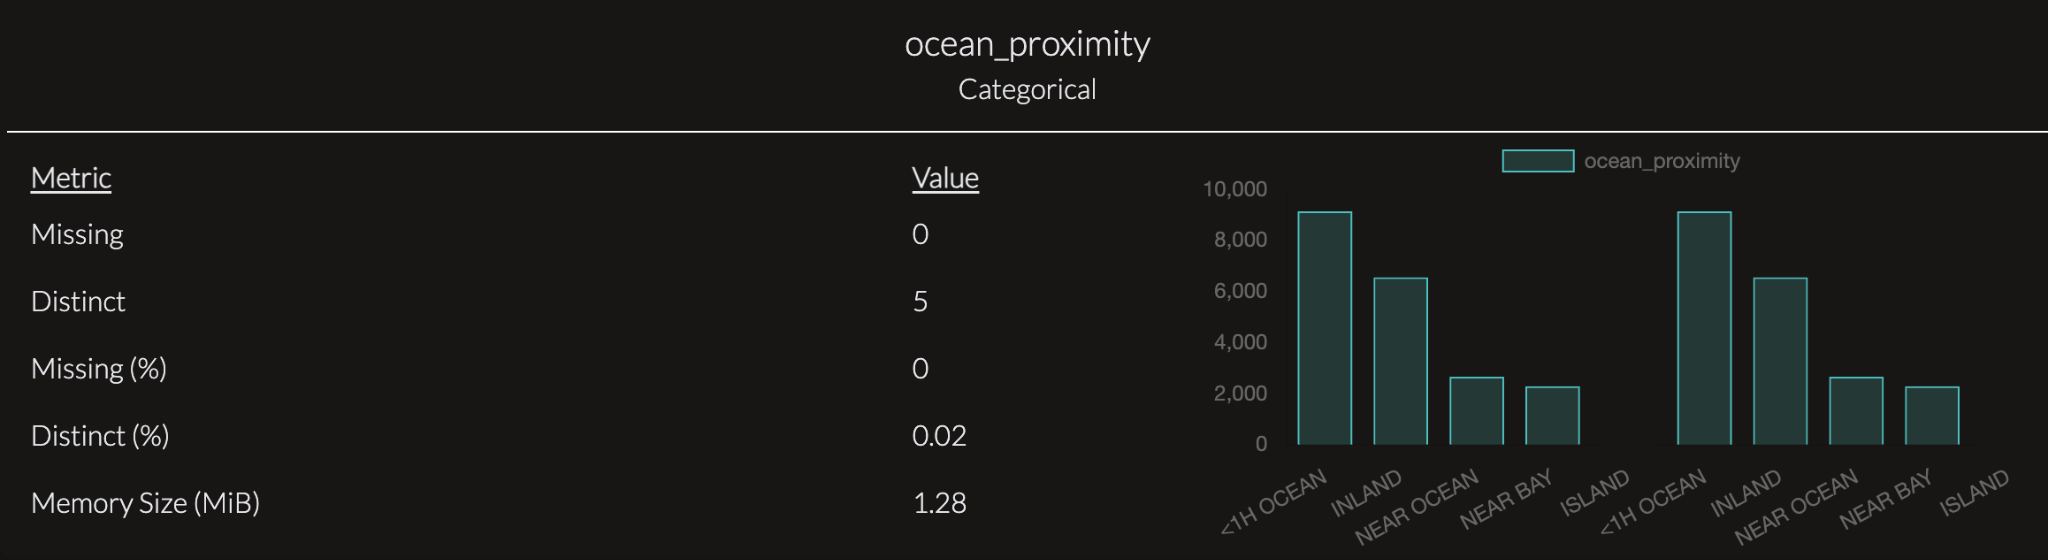
Categorical Columns
This chart summarizes the ocean_proximity categorical variable, which classifies locations based on their distance to the ocean. The data is clean, with no missing values, and contains five distinct categories, showing diversity in the variable. The bar chart reveals that certain categories, such as properties within one hour of the ocean (<1H OCEAN) and those inland, dominate the dataset, while categories like islands and near bays are less common. This provides a clear view of the distribution of locations, enabling non-technical users to easily understand the spread of categorical data.